
What lands in Review Center
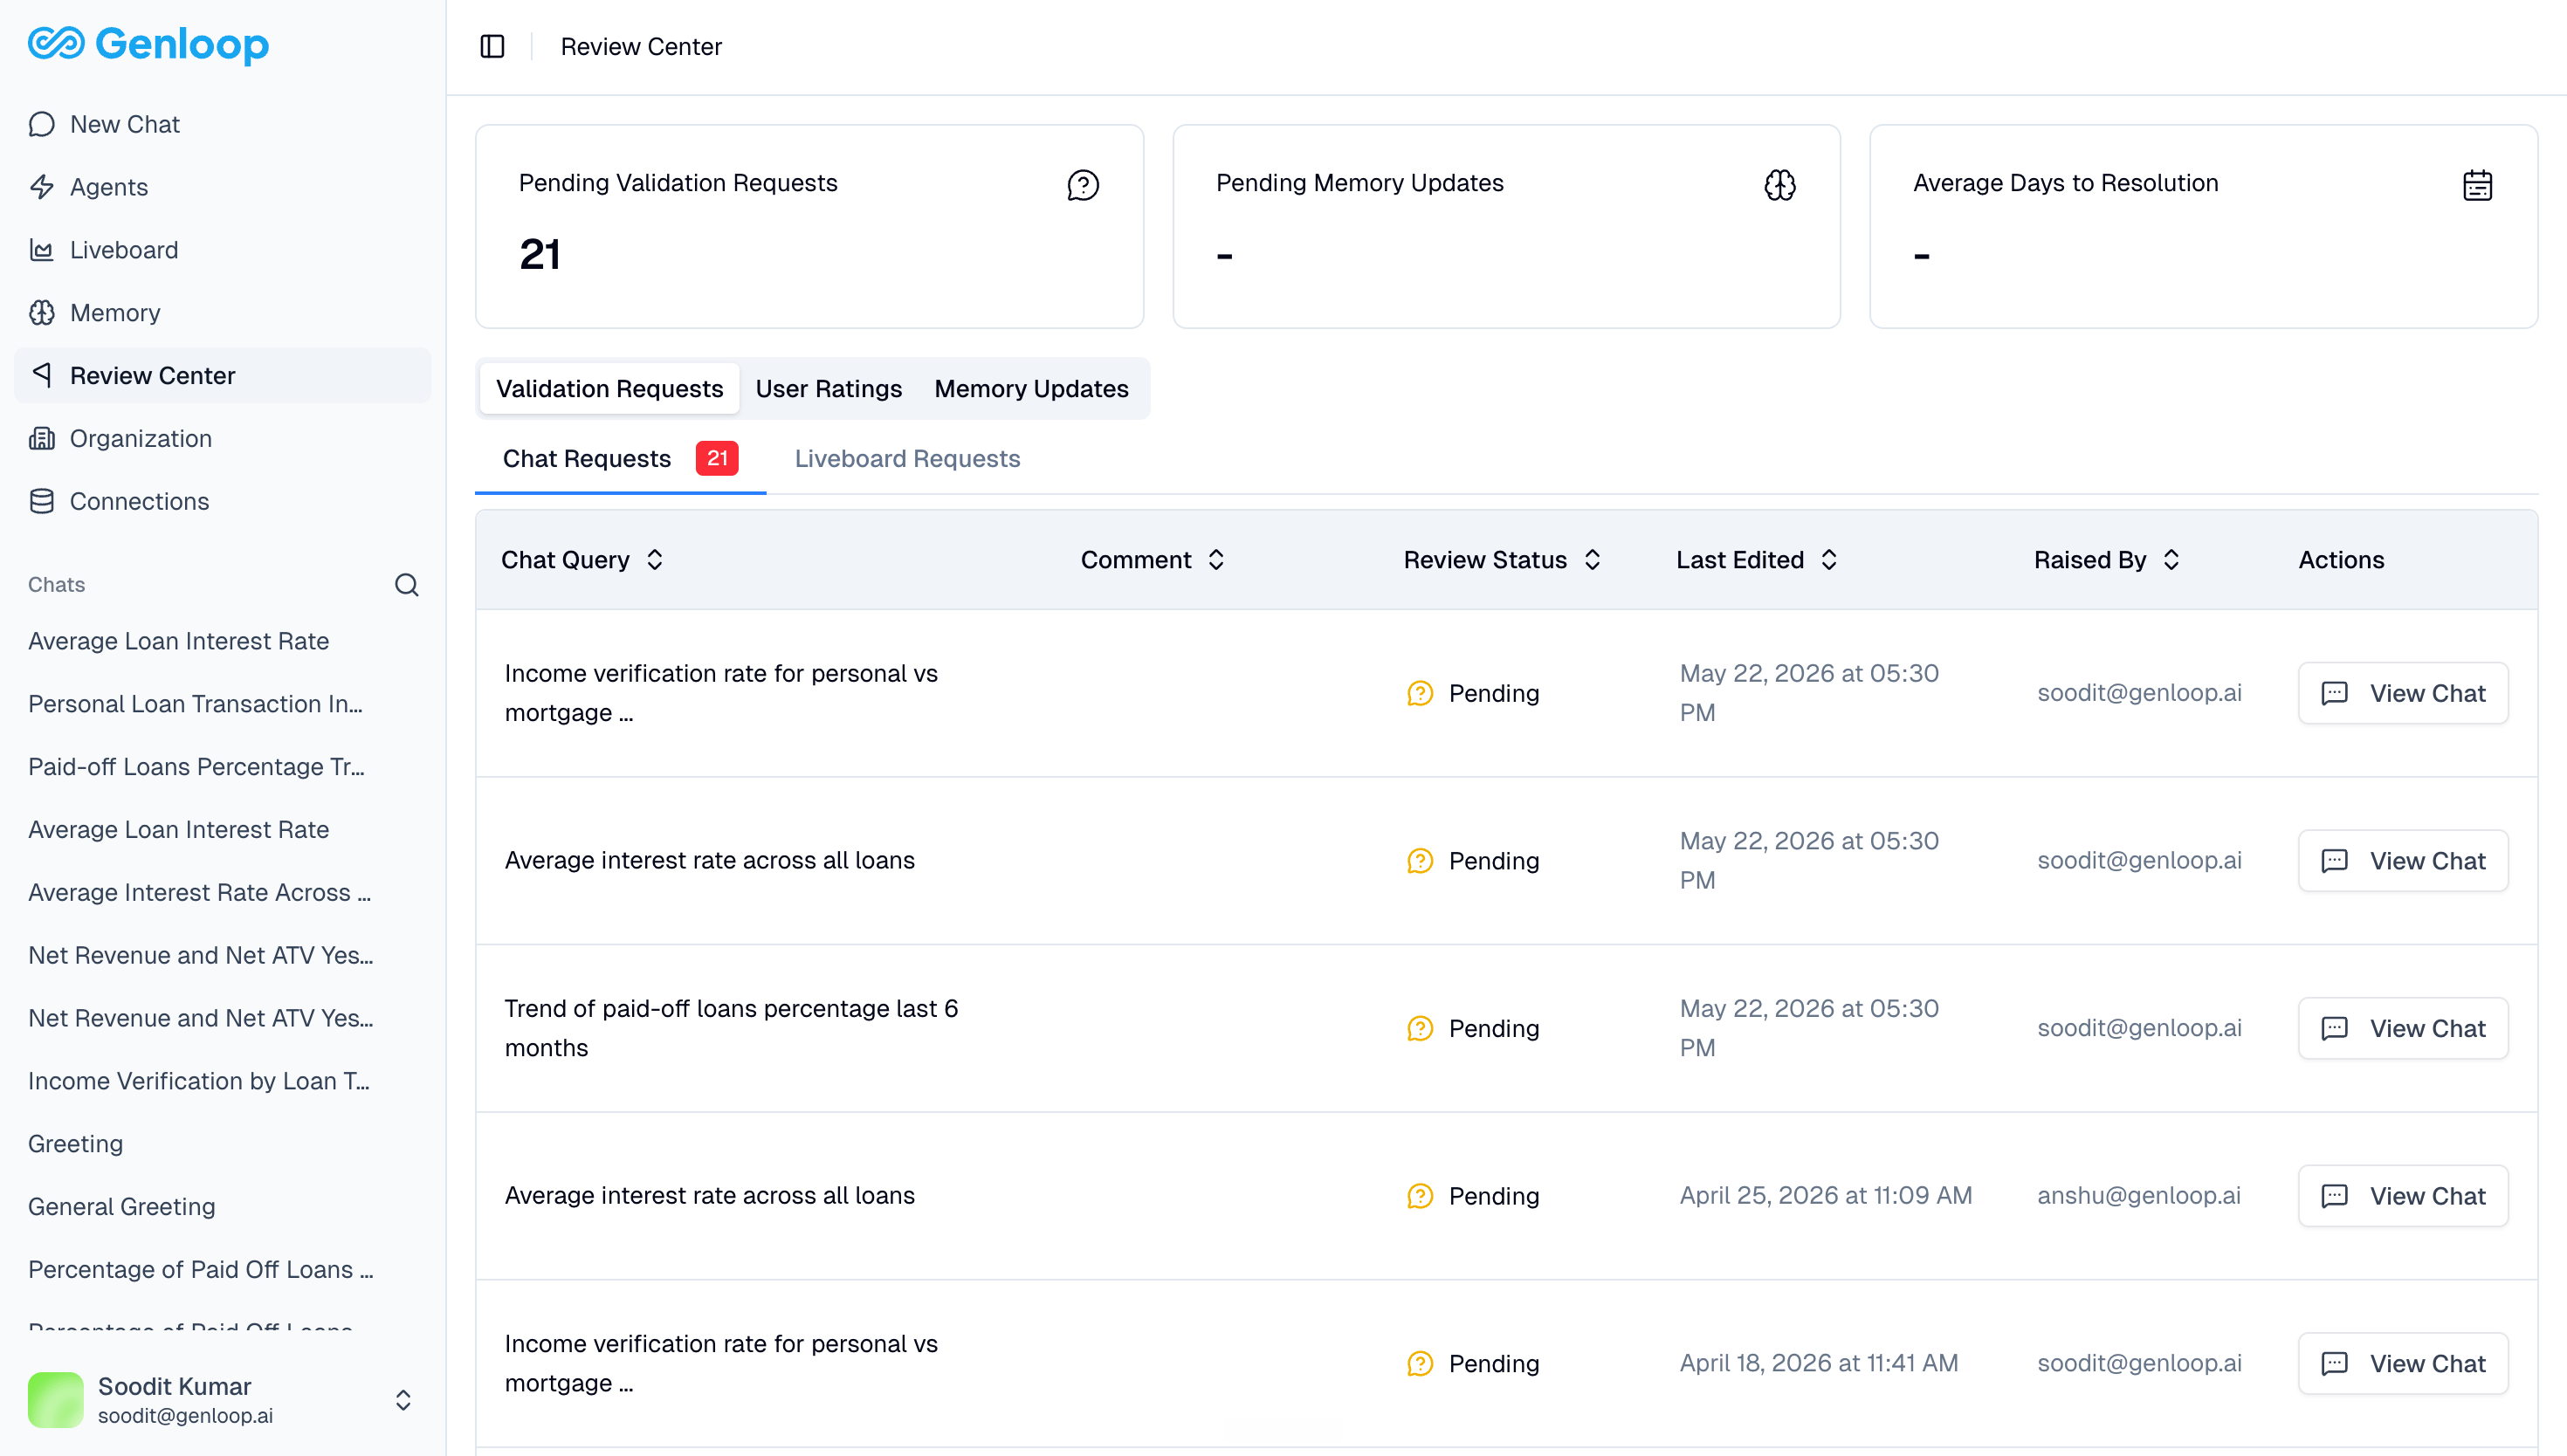
Review Center has three tabs: Validation Requests When a user clicks Request Validation on a Chat answer, it creates a ticket here. Your data team can see the original question, the SQL Genloop generated, and the answer it returned. They can review the logic, mark it as correct or incorrect, and approve it. That approval feeds directly back into the platform as a learning signal. Validation requests are split into Chat Requests and Liveboard Requests. User Ratings Thumbs up and thumbs down feedback from Chat is aggregated here. Your data team can use this to spot patterns — which questions are consistently getting wrong answers, which areas need more context. Memory Updates When Genloop learns something new from interactions and proposes a context update, it surfaces here for review. Your team can approve or reject the update before it becomes part of Context Hub.Who uses Review Center
Review Center is primarily for data team members and workspace admins. It is the main surface for governing what the platform learns and catching issues before they become repeated errors.The average days to resolution metric at the top of the page tracks how quickly your team is turning around validation requests. A high backlog here means users are waiting on answers they are not confident in.
Next steps
Context Hub
See the full knowledge layer that Review Center helps you maintain.
Chat
Understand how users raise validation requests from Chat.